
OTN Appreciation Day : The Log Analysis Tool #ThanksOTN
In the spirit of OTN Appreciation day (Thanks Tim, you are not a kiss-ass), I am posting about my favorite feature in Oracle EPM specifically on today October 11th in appreciation for all the great work that Oracle Technology Network does. For more information on the gesture that is involving many Oracle bloggers from across the globe, look to #ThanksOTN on twitter.
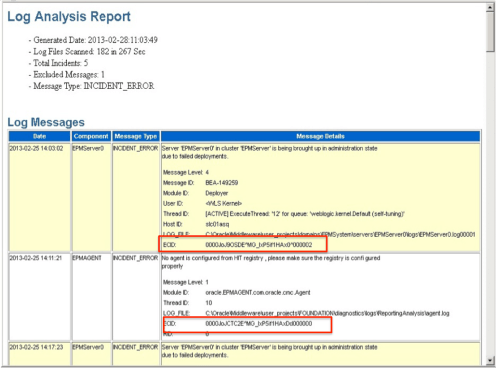
My Favorite? It would have to be the Log Analysis Utility. It came in 11.1.2.3. It’s a nice little tool that will simplify looking at Oracle EPM logs. We no longer have to hunt and scour the filesystem to locate logs. This tool list errors from the entire EPM node in time order. You can filter by product modules, error level, time span, etc. You can also trace the activities of a user session across all EPM system component by tracing a Execution Context ID (ECID) which is a unique identifier for transactions. The Log analysis tool creates an HTML format based report with a time stamped filename.
Using the Log Analysis Utility you can:
- List EPM System errors that occurred within a time period
- Errors related to:
- Services
- Inter-component communication
- User directory communication
- List functional issues that occurred within a time period
- For example, failure during the forms load process in Hyperion Financial Management
- Trace an Execution Context ID (ECID) through log files to trace user sessions across EPM System components
- ECID is a unique identifier that is used to correlate events that are part of the same request execution flow
- Errors related to:
To run the Log Analysis Utility, do the following:
- Log into one of the Windows servers with an administrator ID
- Open a Command Line window and navigate to Oracle\Middleware\user_projects\<EOH>\bin directory
- Run the command bat
You can give arguments to the command to filter your results. The options available are:
- message type (-m INCIDENT_ERROR, ERROR, WARNING, NOTIFICATION, TRACE )
- time range (-t YYYY-MM-DDTHOUR:MIN:SEC YYYY-MM-DDTHOUR:MIN:SEC )
- time in minutes (-tmin 45 )
- a string (-s ” ” )
- a message series across servers (-ecid “0000JpPDIjn9h^FpN0S4ye1HFRt100000J” )
- output limited to size in megabytes (-maxsize 5 )
- optional HTML output name (-o ” ” )
The resulting HTML file is saved for you in : /Oracle/Middleware/user_projects/epmsystem1/diagnostics/reports
So here is a use case. Say a user us having getting a specific error. You can run the following command to list all the logs for the last day:
loganalysis –system –tdays 1
Search these results and look for the corresponding ECID. Then you can run the utility again, with the –ecid argument. That will return all logs across the whole node associated with that transaction in time-order. A great way to dissect the anatomy of a transaction and the path it went on in a fraction of the time it would take to do manual inspection of logs on the filesystem.
Pro tip:
Oracle delivers this utility on My Oracle Support as a patch. Sign in click the Patches & Updates tab, enter the patch number 17425397.
Find more information on the Log Analysis Utility here: http://docs.oracle.com/cd/E40248_01/epm.1112/epm_troubleshooting.pdf


